
First class analysis of your SCOM environment
Silect’s dashboards expose Operation Manager’s health and key performance indicators at a glance.
They help to easily understand which data is collected, how much they consume and what are the noisiest elements.
Various causes of SCOM performance issues can be identified with a single click!
|
Note: The dashboards only require Power BI Desktop (free!) to gather their information directly from your SCOM environment. |
Introduction
Management Packs (MPs) make SCOM aware of specific workload that should be monitored. MPs exist for Operating Systems, Active Directory, VMWare, Databases and even Azure and Office 365. Software vendors and independent authors offer them either for free or for an affordable price.
By importing a Management Pack new objects are created in SCOM. Classes which are blueprints of the items that should be monitored, monitors which represent the health state, rules which record performance information or warn about mis-configuration and many more.
While usually the agent on the monitored computer does the checking via the code that comes inside the MPs, the Management Server receives the data and forwards them to its Databases.
With the Management Servers’ Console or the Web interface it let’s you check the received information from agents, offers you tools to create own monitoring settings, displays performance graphs and others. Management Servers also do a bunch of calculations in the background.
Some Management Packs are also designed to run their checks only on the Management Server for various reasons.
Each Management Pack creates additional work for the Management Server.
Such only MPs for workloads that are important to your environment should be imported.
Furthermore, for those workloads only rules and monitors shall be enabled that make sense must be turned on. – Others to be disabled.
Main section
Maintenance is one important aspect of operating a SCOM environment.
The SCOM administrator takes care that the system itself is healthy, helps that its users are not overwhelmed with alerts and ensures that it responds in a timely manner.
The Dashboards
Ten screens present different aspects of your OpsMgr environment.
|
Note: The screenshots have been taken from a customer with 650 Windows Servers and 20 Linux machines. This helps to better present 😊 |
Agents Overview

Scans the individual server against the classes (blueprints), measures counters and performs calculations defined in the MP and sends them to the Management Servers.
- – Unhealthy Agents, Unknown State Agents (grey color in SCOM)
- – Pending Management Agents
- – Agents without Failover
- – Total Agents number
-> Agents in unknown state and unhealthy ones cannot deliver data so need to be fixed!
OM DB

SCOM’s working database, stores short-term information and configuration. – It should be always enough space available.
Grooming takes care that old data is deleted, and that data is aggregated and moved to the correct tables for long term storage
- – Data- and Log file size, free space and space unused
- – Grooming tasks
-> Estimate the size in the next few months and change the size instead of using AutoGrow!
-> Ocassional failures can be ignored. Enduring ones must to be fixed to avoid endless DB growing and performance issues.
OM DW DB
SCOM’s database for long term information. Especially used when using the reports. – It should be always enough space available.
- Data- and Log file size, free space and space unused
OM DB Backup

SCOM’s database backup state. In case of a disaster the database backup is required to get the system back. It should be performed daily.
- – Time Taken and the Backup Size is shown in relation.
- – The slicer and the drop-down menu allow the specification of the date range.
OM DW DB Backup
As previous screen just for the datawarehouse database.
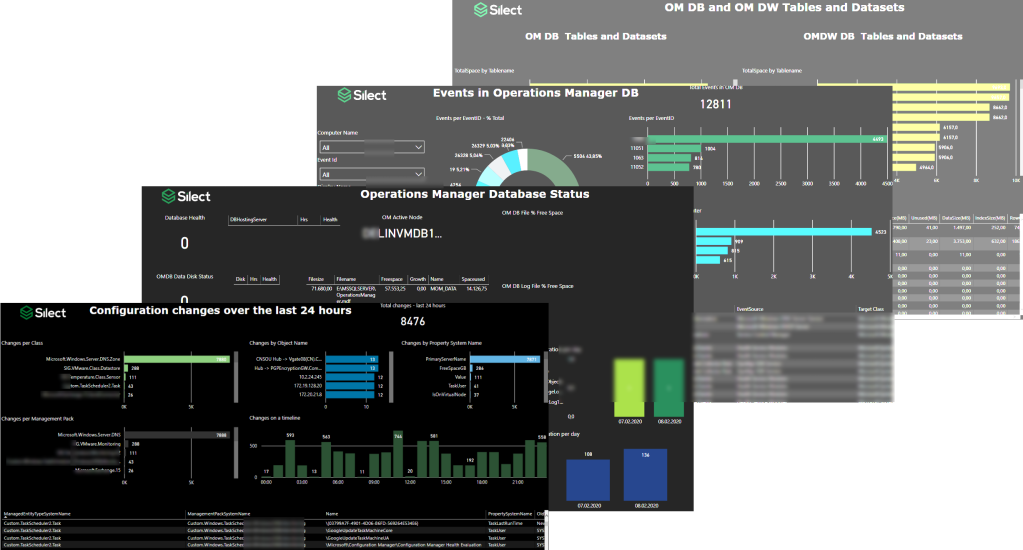
Config Churn

Objects that represent the items which are monitored by SCOM are made of classes which are defined in the MP. Classes have attributes (properties) that will store values. This screen is dedicated to the property changes.
- – Changes per Class
- – Changes per Management Pack
- – Changes on timeline
- – Changes by Object Name
- – Changes by Property System Name
-> A high amount of changes has dramatical impact to SCOM performance and shall be avoided.
-> In this case DNS Zone class, more specifically its PrimaryServerName attribute is updated too frequently. => As not required in this environment, the DNZ zone discovery has been disabled to improve the performance.
Events in Operations Manager DB

Events are written, mostly for informational purposes without the direct need of action. – In other cases, they are similar to debug messages that developers write to track their program code behavior in detail.
- – Events per Event ID – % Total
- – Events per Event ID
- – Events per Logging Computer
- – A table containing details of the Event for overview
-> Events shall be checked from time to time, if no value can be found the corresponding rules shall be disabled. Less information written to the DB results in better performance!
Monitor State Changes – last 24 hours
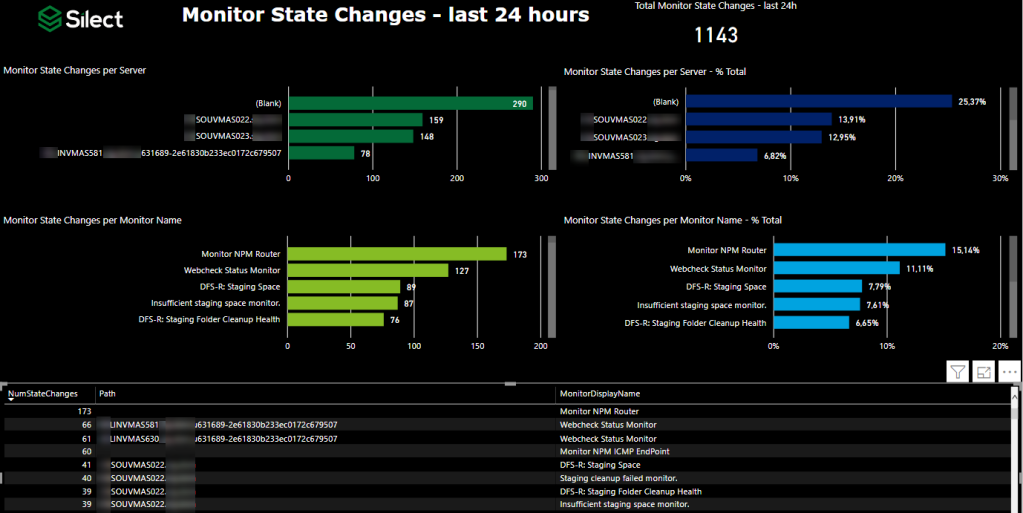
Monitors determine the health state of an object. They are either green (healthy), yellow (warning) or red (critical) state. State changes is the event when the monitor changes an object from one color to another.
- – Monitor State Changes per Server
- – Monitor State Changes per Monitor Name
- – Monitor State Changes per Server – % Total
- – Monitor State Changes per Monitor Name – %Total
-> As most Monitors automatically switch to healthy once the good condition is identified, it happens that some problems keep unidentified. That must not be a problem. Checking this screen can help to discover such issues and can help to perform measures until they become a problem.
-> Another reason for too frequent state changes are default thresholds that do not fit to your requirement. – An override to the right level fixes the problem permanently.
OM DB and OM DW Tables and Datasets

As SCOM stores all its information in databases, those grow over time. This screen gives you an idea what kind of data is stored in the DB and how much it is.
- – TotalSpace by Tablename (Database)
- – TotalSpace by Tablename (Datawarehouse Database)
- – OperationsManager Tables (Overview table)
-> First part to control the data storage requirements is by changing the retention of the different information types in in the Operations Manager console (Administration – Settings – Database Grooming).
-> Second part is changing the grooming settings via tool named DWDATARP.
=> For both: Store the data only as long as required.
Performance Collection – Last 24 hours

Collecting performance data over time helps to understand an applications behavior, allow prediction for capacity management and help to spot bugs like memory leaks.
In SCOM, rules do the job of collecting those metrics and they are store in Operations Manager database for short and for long term in the datawarehouse db.
This screen gives insights how many samples are collected by which rule.
- – Filter for Counter Name, Object Name or Rule Name
- – TotalSamples by ObjectName
- – TotalSamples by CounterName
-> To not waste disk space and keep the database performing well, disable rules that collect data you don’t need.
Version
- – Refresh Date
- – – When the last data has been queried from the SCOM environment
- – Publish Date
- – – When these dashboards were released for testing.
Conclusion
Silect’s Dashboards significantly improve regular checks. They cover all important aspects that shall be taken care of and represent them easy to consume.
Most important; they let you handle the job quick and with fun 😊
Without the dashboards manual checking is required. Using SQL Management Studio to check the database, running reports to identify objects which frequent state changes or using the SCOM console to get an overview of agents. Some information need SQL commands that can’t be easily.
These dashboards are a must have for every committed SCOM admin.
Great product!
Further reading
- SCOM Basics – Alerting:
- Management Pack tuning:
- Config Churn:
- Datawarehouse grooming:
- Event Collection:
Prepared by Ruben, 2020-02-11
